What does it look like ?
As a monitoring tool, it uses graphs and charts to summarize information. SQLHealth simplifies the information it receives from your databases and presents this is an easy to digest format that allows you to make decisions quickly. Other database tools can sometimes present too much information, making it hard separate the signal from the noise. SQLHealth focusses on simplicity. Here are some examples.
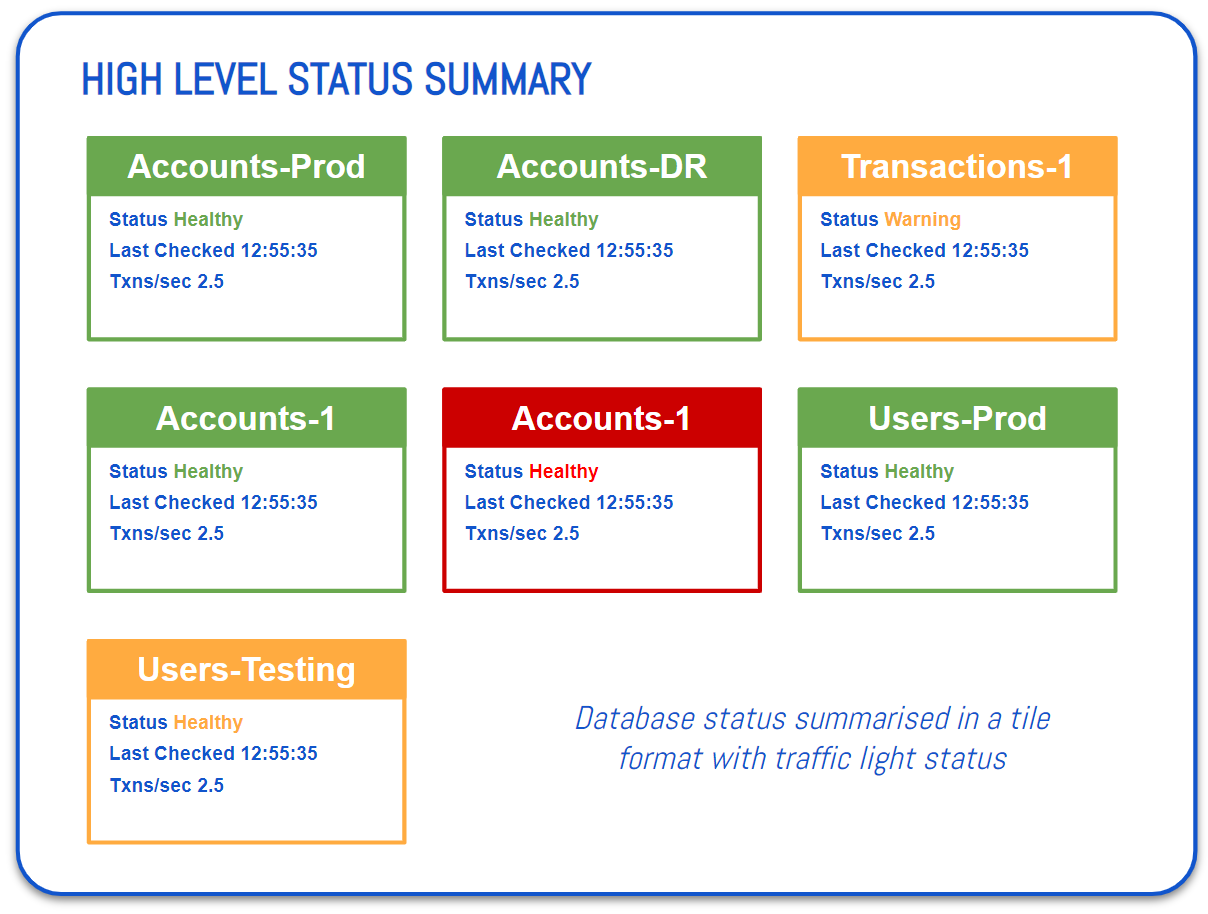
High level status of all databases
Initially SQLHealth presents you with a high-level status of the health of each of your databases. This takes the form of tiles arranged in groups, with selected datapoints displayed. Each database can have rules configured that determine when to set the status as green, orange or red. The status is based on (a) availability - is the database responding and (b) are all queries performing within configured time limits. What you need to know in one view.
Query execution speed
Knowing which queries in your databases are performing poorly is a key part of maintaining performance. SQLHealth shows you your query execution times mapped against a warning threshold and a failure threshold. Should any of your queries exceed these thresholds, you will be alerted by SMS, mail or both.
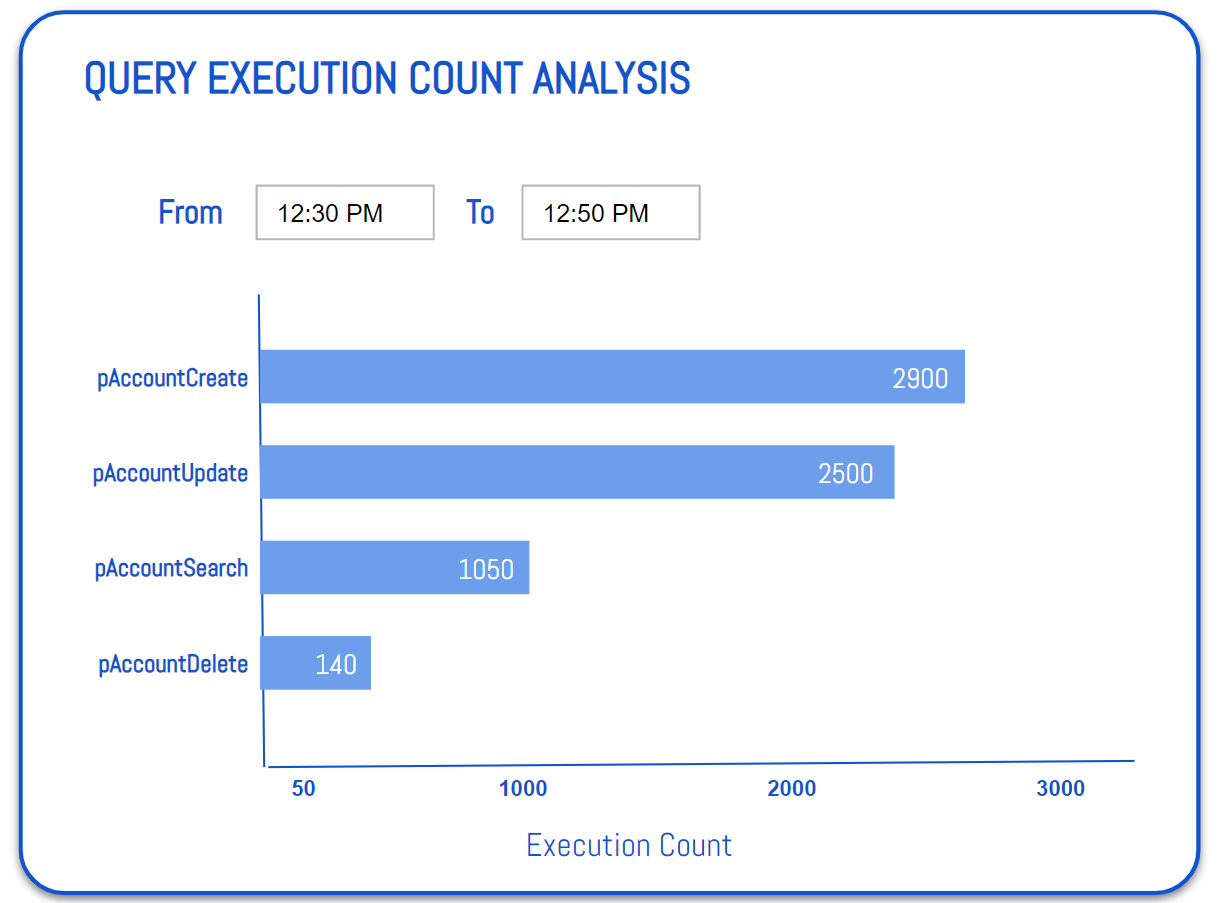
Query execution count analysis
Knowing how often different queries are being executed helps you identify where performance improvements may have the biggest impact. SQLHealth shows you execution frequency for your queries (or stored procedures) allowing you to spend your time tunning the ones that are executed most.
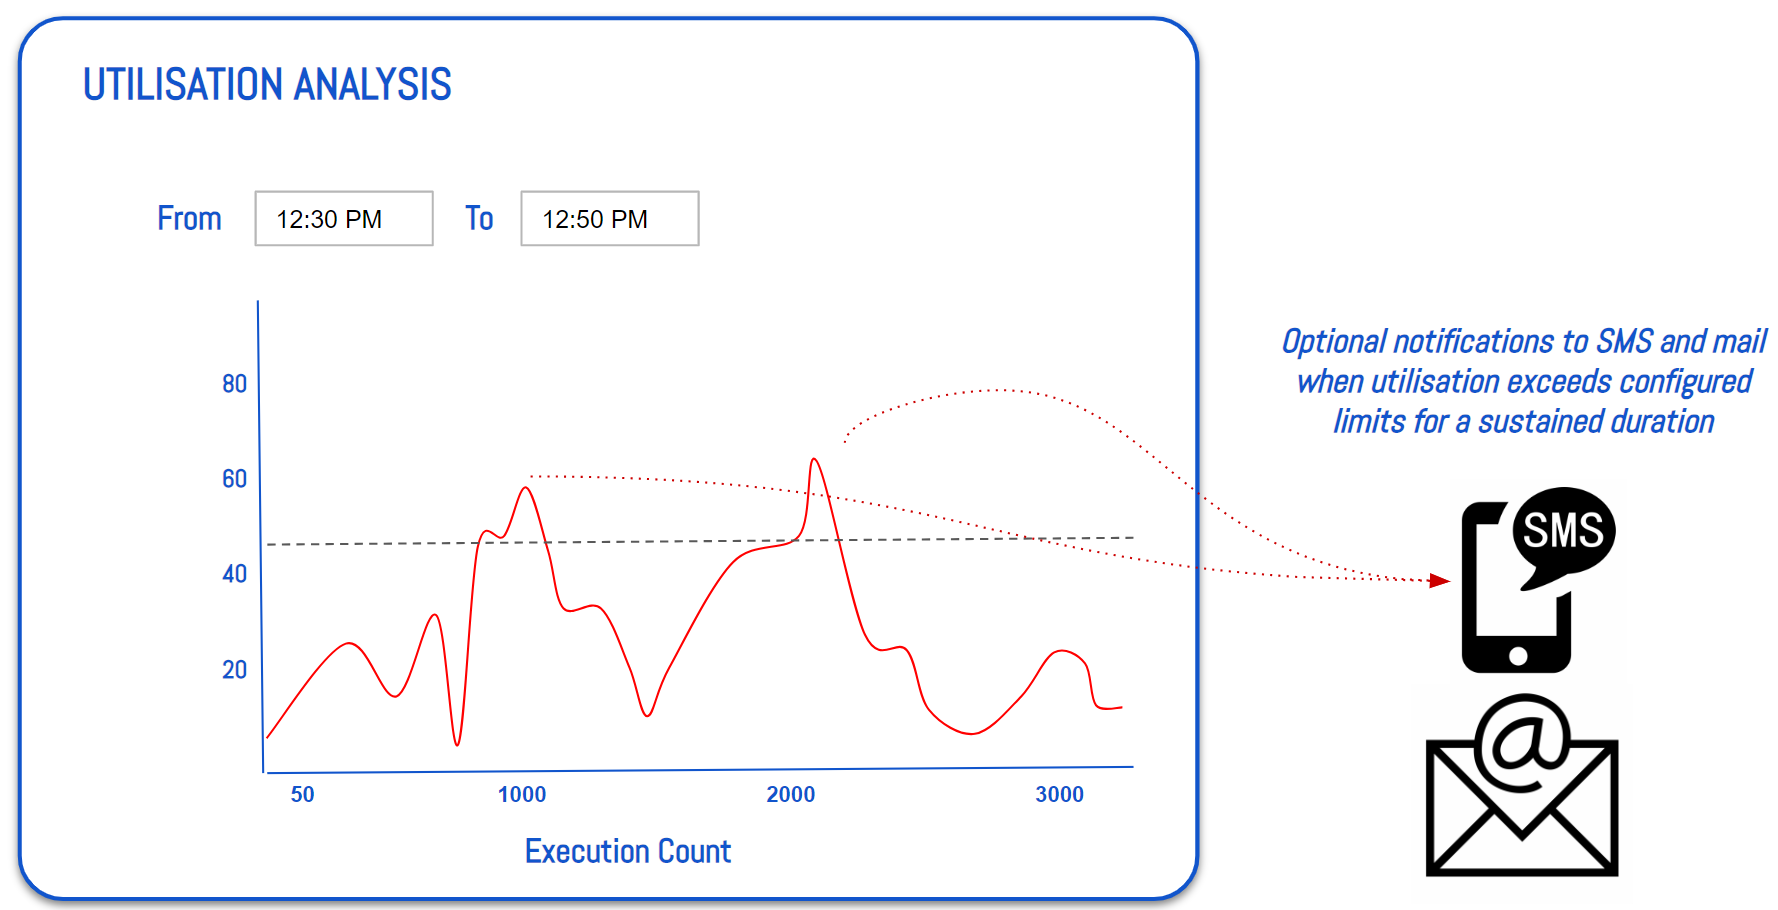
Utilisation analysis
Understanding when your database become CPU constrained is an important part of managing it’s performance, as well as making sure you have the right sized machine underneath it. Equally important is to know if a database constantly runs at a very low CPU utilisation as this may be a signal that you can reduce the size of the machine instance it is running on (important cost saving tactic when running in Amazon RDS).